
The State LSAC Applicant Pool and Excess Whiteness
 One way to measure the effectiveness of legal education is to ascertain how well the law schools are enrolling students from diverse racial backgrounds. The total percentage of White students in law school was assessed against the state LSAC applicant pool.
The expectation is that law school will be no Whiter than the available state pool. Clearly, many applicants from a state do not want to attend law school in that state. However, the percentage of applicants from a state is a relevant pool for diversity assessment
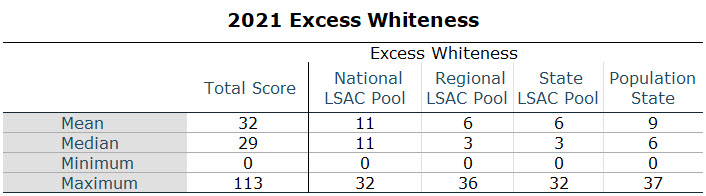
State Whiteness was calculated by dividing the total number of White applicants from a state by its total number of applicants. The table identifies the Whiteness in the state applicant pool. Maine had the Whitest student applicant pool (90%) and Puerto Rico had the least White applicant pool (2%). Seventy-six schools (38%) had no Excess Whiteness based on the state LSAC application pool. Of the 124 schools with Excess Whiteness, the average Excess Whiteness was 6 points; the median Excess Whiteness was 3 points; the minimum Excess Whiteness was 0 and the maximum Excess Whiteness was 32 points.
| State of Law School | State Applicant Pool Percentage White | State of Law School | State Applicant Pool Percentage White |
| Alabama | 71 | Nebraska | 81 |
| Arizona | 61 | Nevada | 55 |
| Arkansas | 76 | New Hampshire | 87 |
| California | 46 | New Jersey | 60 |
| Colorado | 75 | New Mexico | 46 |
| Connecticut | 73 | New York | 60 |
| Delaware | 56 | North Carolina | 60 |
| District of Columbia | 62 | North Dakota | 87 |
| Florida | 46 | Ohio | 78 |
| Georgia | 49 | Oklahoma | 63 |
| Hawaii | 23 | Oregon | 76 |
| Idaho | 82 | Pennsylvania | 77 |
| Illinois | 65 | Puerto Rico | 2 |
| Indiana | 77 | Rhode Island | 75 |
| Iowa | 85 | South Carolina | 67 |
| Kansas | 79 | South Dakota | 88 |
| Kentucky | 84 | Tennessee | 72 |
| Louisiana | 62 | Texas | 47 |
| Maine | 90 | Utah | 81 |
| Maryland | 49 | Vermont | 89 |
| Massachusetts | 72 | Virginia | 62 |
| Michigan | 74 | Washington | 67 |
| Minnesota | 80 | West Virginia | 89 |
| Mississippi | 62 | Wisconsin | 81 |
| Missouri | 78 | Wyoming | 85 |
| Montana | 88 |
Correlations
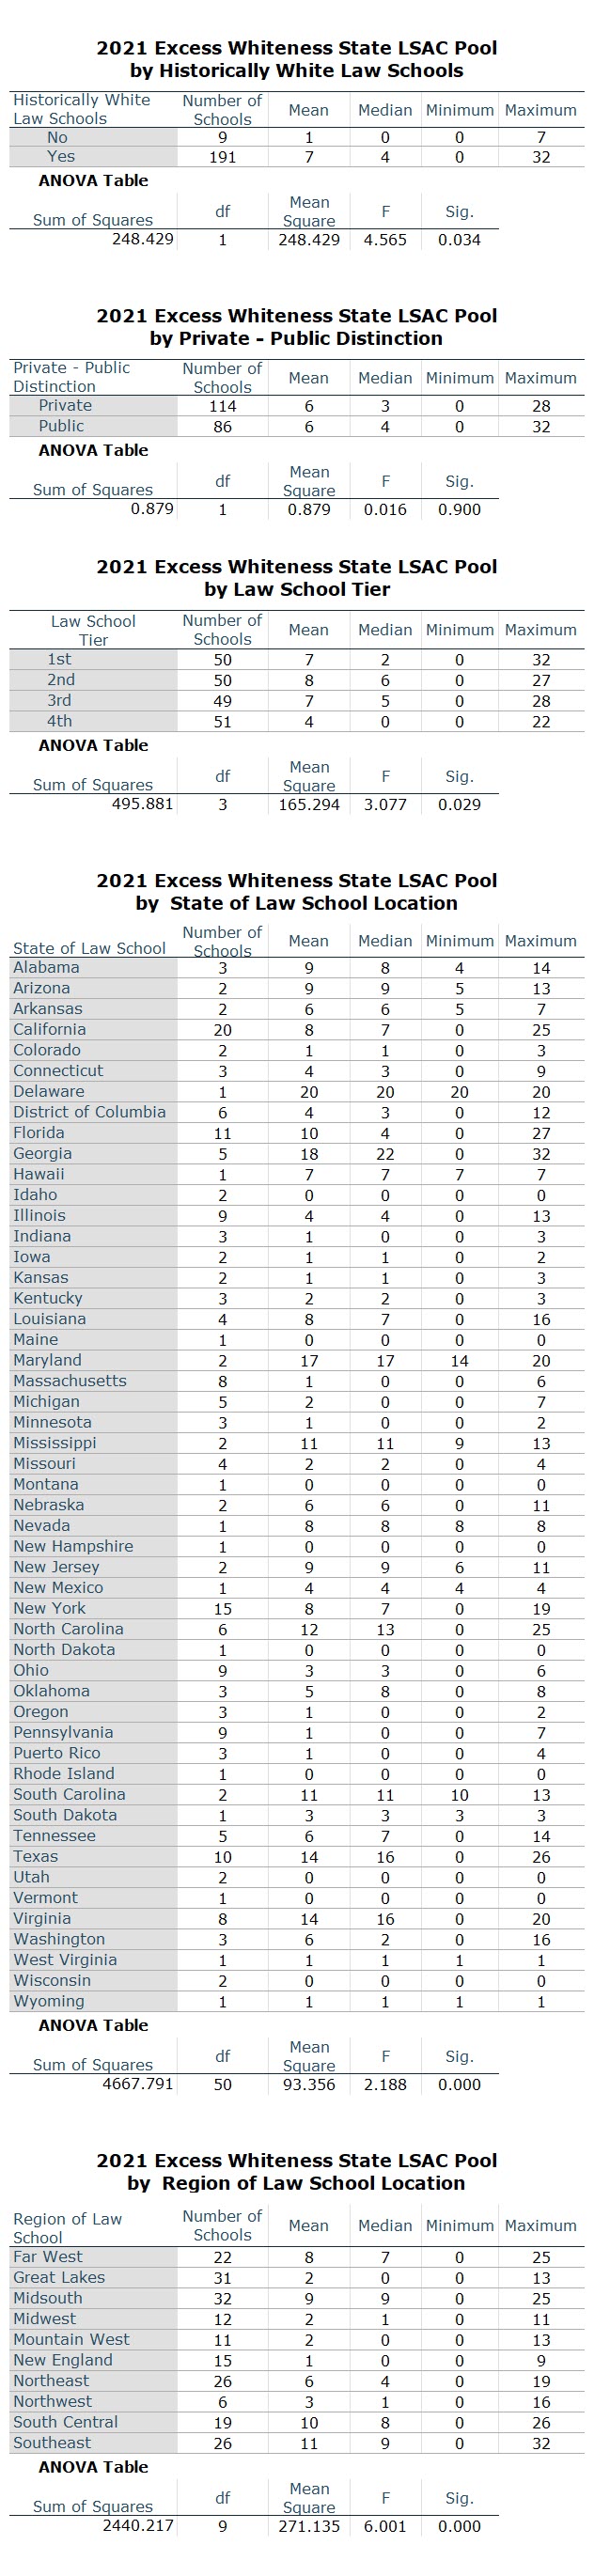
- Historically White Law Schools. The difference in the mean between historically White law schools (7 points) and non-historically White law schools (1 point) was statistically significant (p=.034).
- Public vs. Private. Private schools had the same mean difference in Excess Whiteness points (6) as public law schools (6).
- Tiers. There was a difference in mean points based on tiers. The second-tier had the highest mean (8 points) and the fourth tier had the lowest (4 points), The difference was statistically significant (p=.029).
- States. There was a difference in mean among states. Georgia had the highest mean difference (22.4 points ), and Montana had the lowest (.111 points). The difference among states was statistically significant (p=.000).
- Region. There was a difference in mean among regions, The Southeast region had the highest mean Excess Whiteness points (15.8), and the Mountain West had the lowest (3.7). The difference among states was statistically significant (p=.000)
Charts and Tables
 |
The State LSAC Applicant Pool
and Excess Whiteness Database
This database includes all 200 schools. It can be sorted by columns and searched. Click on a row for additional information.
Legend: TWLS The Whitest Law School; EW Excess Whiteness; TW Total Whiteness; FY First Year; LSAC Law School Admission Council; Pop Population.