
 The racial disparity grade is based on a determination of how much racial difference there is in the exclusion of students from schools/districts.
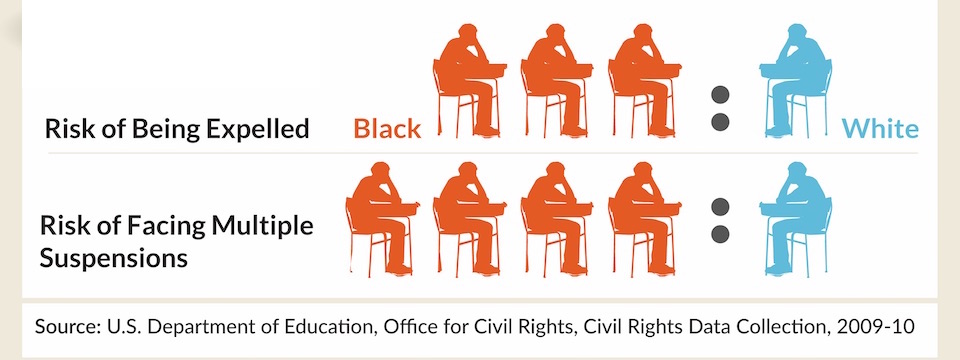
Exclusion includes discipline occurrences of Expulsion, out-of-school suspension, Emergency removal by district personnel, and Removal by hearing officer.
A rate per 100 students was calculated for each of the seven racial groups recognized by the State of Ohio: American Indian or Alaskan Native, Asian, Black, Hispanic, Multiracial, Pacific Islander and white. The average "highest exclusion rate" for the state was 51 exclusions per 100 students.
Then for each school, the racial group with the highest exclusion rate was identified: Black Students had the highest exclusion rate in 354 of the school/districts (40.3%).
A racial disparity ratio was calculated; that is comparing the racial group with the highest exclusion rate to the average exclusion rate for the other racial groups in a particular school. The mean racial disparity ratio was 15.6; that is in the state of Ohio, on average school/districts were 15 times more likely to exclude students from one racial group than the average exclusion from other
Grade: Three schools earned a grade of 100 because they did not have any racial disparity in their exclusion rates. While another 4.7% earned between 90 to 95 for having a racial disparity ratio less than or equal to 1.44. On the other hand, 20 of the districts (2.3%) earned a "0" for having racial disparity ratio greater than or equal to 99.45. Most schools (600 or 68.3%) earned a grade of 40 for racial disparity ratio between 1.45 to 9.44. Community (Charter) Schools had a higher mean grade (40.11) than Public District (36.98). This difference was statistically significant (p=.005)