
 The racial disparity grade is based on a determination of how much racial difference there is in the exclusion of students from schools/districts.
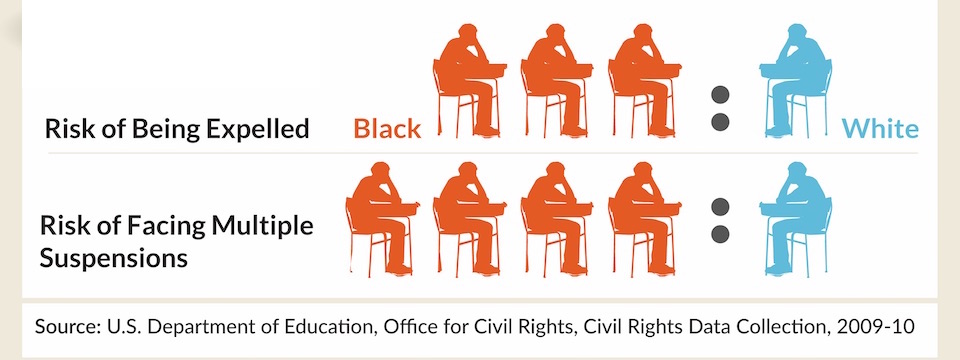
Exclusion includes discipline occurrences of Expulsion, out-of-school suspension, Emergency removal by district personnel, and Removal by hearing officer.
A rate per 100 students was calculated for each of the seven racial groups recognized by the State of Ohio: American Indian or Alaskan Native, Asian, Black, Hispanic, Multiracial, Pacific Islander and white. The average "highest exclusion rate" for the state was 51 exclusions per 100 students.
Then for each school, the racial group with the highest exclusion rate was identified: Black Students had the highest exclusion rate in 354 of the school/districts (40.3%).
A racial disparity ratio was calculated; that is comparing the racial group with the highest exclusion rate to the average exclusion rate for the other racial groups in a particular school. The mean racial disparity ratio was 15.6; that is in the state of Ohio, on average school/districts were 15 times more likely to exclude students from one racial group than the average exclusion from other
Grade: Three schools earned a grade of 100 because they did not have any racial disparity in their exclusion rates. While another 4.7% earned between 90 to 95 for having a racial disparity ratio less than or equal to 1.44. On the other hand, 20 of the districts (2.3%) earned a "0" for having racial disparity ratio greater than or equal to 99.45. Most schools (600 or 68.3%) earned a grade of 40 for racial disparity ratio between 1.45 to 9.44. Community (Charter) Schools had a higher mean grade (40.11) than Public District (36.98). This difference was statistically significant (p=.005)
Racial Disparity Grade
The racial disparity grade was assigned grades based on the following value - any significant racial disparity is failing. In the context of this report card, any racial disparity ratio greater than 1.44 is failing. However, to recognize the significant difference between 1.45 racial disparity ratio and 99.45 racial disparity ratio, failing grades were assigned from 0 to 40. A racial disparity ratio of 1.45 means that the racial group with the highest exclusion rate was 1.45 times more likely to be excluded than other racial groups in the particular school. While a racial disparity ratio of 99.45 means that the racial group with the highest exclusion rate was 99.45 times more likely to be excluded than the other racial groups in the particular school or district.
Three schools earned a grade of 100 because they did not have any racial disparity while another 4.7% earned between 90 to 95 for having less than or equal to 1.44 racial disparity ratio.
On the other hand, 20(2.3%) of the districts earned a "0" for having racial disparity ratio greater than or equal to 99.45.
Most schools (600 or 68.3%) earned a grade of 40 for a racial disparity ratio between 1.45 to 9.44.
|
Grade |
Racial Disparity Ratio |
Frequency |
Percent |
Valid Percent |
Cumulative Percent |
|
100 |
0 |
3 |
0.3 |
0.3 |
0.3 |
|
95 |
.01 to .44 |
8 |
0.9 |
0.9 |
1.3 |
|
90 |
.45 to 1.44 |
33 |
3.8 |
3.8 |
5.0 |
|
40 |
1.45 to 9.44 |
600 |
68.3 |
68.3 |
73.3 |
|
30 |
9.45 to 19.44 |
131 |
14.9 |
14.9 |
88.2 |
|
20 |
19.45 to 45,44 |
56 |
6.4 |
6.4 |
94.5 |
|
10 |
45.45 to 99.44 |
28 |
3.2 |
3.2 |
97.7 |
|
0 |
>=99.45 |
20 |
2.3 |
2.3 |
100.0 |
|
Total |
879 |
100.0 |
100.0 |
(NOTE: For some school districts this is an approximation of the racial disparity ratio since they report enrollment as "less than10" and exclusions as "less than 10". In those circumstances, we used "5" as the enrollment number and "3" as the exclusion number. Please check with your school district for more accurate information)
Community (Charter) Schools had a higher mean grade (40.11) than Public District (36.98). That difference was statistically significant (p=.005). That is, there was less than a .5% probability that the difference occurred by chance alone.
|
Racial Disparity by Organization Type |
|||||
|
Organization Type |
Number of Districts |
% of Total Number of Districts |
Mean |
Median |
Minimum |
|
Community (Charter) School |
273 |
31.1% |
40.11 |
40.00 |
0 |
|
Public District |
606 |
68.9% |
36.98 |
40.00 |
0 |
|
ANOVA |
|||||
|
Sum of Squares |
df |
Mean Square |
Sig. |
||
|
1843.528 |
1 |
1843.528 |
0.005 |
||
Type 3 Small Town earned the lowest mean grade (34.6) while Type 6 Suburban earned the highest mean grade (41.4). However, the difference in racial disparity grade was not statistically significant. (p=.215).
|
Racial Disparity Grade by Typology of Public Districts |
|||||
|
Typology of Public Districts |
Number of Districts |
% of Total Number of Districts |
Mean |
Median |
Minimum |
|
Type 1: Rural - High Student Poverty & Small Student Population |
123 |
20.3% |
35.33 |
40.00 |
0 |
|
Type 2: Rural - Average Student Poverty & Very Small Student Population |
105 |
17.4% |
36.57 |
40.00 |
0 |
|
Type 3: Small Town - Low Student Poverty & Small Student Population |
110 |
18.2% |
34.64 |
40.00 |
0 |
|
Type 4: Small Town - High Student Poverty & Average Student Population Size |
89 |
14.7% |
38.43 |
40.00 |
10 |
|
Type 5: Suburban - Low Student Poverty & Average Student Population Size |
77 |
12.7% |
36.88 |
40.00 |
10 |
|
Type 6: Suburban - Very Low Student Poverty & Large Student Population |
46 |
7.6% |
41.41 |
40.00 |
10 |
|
Type 7: Urban - High Student Poverty & Average Student Population |
47 |
7.8% |
39.15 |
40.00 |
30 |
|
Type 8: Urban - Very High Student Poverty & Very Large Student Population |
8 |
1.3% |
40.00 |
40.00 |
40 |
|
Sum of Squares |
df |
Mean Square |
Sig. |
||
|
2339.023 |
7 |
334.146 |
0.215 |
||
Racial Disparity Ratio
The racial disparity ratio calculates the relationship between two numbers indicating how many times the first number contains the second. For example, if a bowl of fruit contains eight oranges and six lemons, then the ratio of oranges to lemons is eight to six. In the case of racial disparity ration, the exclusion rate for the highest group is divided by the average exclusion rate for the other racial groups.
|
Steps |
Example District Name |
Akron City |
|
1 |
Identify the highest exclusion rate by a racial group in the district. |
77.0 |
|
2 |
Identify the racial group with the highest exclusion rate. |
Black |
|
3 |
Calculate the number of different racial groups in the district. |
7 |
|
4 |
Calculate Average Exclusion Rate of the other Racial Groups in the district. |
19.5 |
|
5 |
Calculate the Racial Disparity Ratio by dividing the Highest Exclusion rate (Step 2) by the Average Exclusion Rate (Step 4) |
4.0 |
|
1 |
Identify the highest exclusion rate. Calculate an exclusion rate for each racial group present in a particular school. Ohio divides its student population into seven racial groups: American Indian, Asian, Black, Hispanic, Multiracial, Pacific Islander, and white. The Exclusion rate is the total of the following disciplinary occurrences: expulsions, out-of-school suspensions, Removal by Hearing officer and Emergency Removal by District Personnel divided by total enrollment for the school. For some school districts, this is an approximation since these schools/districts report enrollment as "less than10" and exclusions as "less than 10". In those circumstances, we used "5" as the enrollment number and "3" as the exclusion number. Please check with your school district for more accurate information) For the example below, Akron City, the highest exclusion rate was 77 per 100 students. That is in Akron 77 exclusions occurred per 100 Black students. Focusing on the highest exclusion rate, the mean or average rate was 51.1. That is, on average, 51.1 exclusions occurred per Black 100 students. For half the districts, the highest exclusion rate was 33.8. That is, half the schools were excluding one racial group at 33 exclusions per 100 students from the particular racial group. Three schools had no exclusions. The maximum highest exclusion rate was 420, that is 420 exclusions per 100 students from the specific racial group.
Highest Exclusion Rate by Organization Type Community (charter) school had the highest mean exclusion rate by racial grouping at 75.3 exclusions per 100 students in a particular racial group. While Public District mean was 40.3. Community schools had a higher median with half their schools having exclusion rates over 60 per 100 students. While some Public Districts reported no exclusions, every reporting community (Charter) school had some exclusions. This difference between community (Charter) schools and Public District was statistically significant (p<.000); that is a zero probability that this difference occurred by chance alone
Highest Exclusion Rate * Typology of Public Districts Type 7- Urban schools had the highest mean exclusion rate by racial grouping at 65.4 exclusions per 100 students in a particular racial group. While Type 3 Suburban schools had the lowest mean, 17.9. Type 8 Urban schools had the highest median with half their schools having exclusion rates over 55.8 per 100 students. Only Type 2 Rural districts reported districts with no exclusions and type 8 urban districts had the highest minimum (36.10) While type 7 Urban schools had the highest rate (300 exclusions per 100 students). This difference between Public Districts based on typology was statistically significant (p<.000); that is a zero probability that this difference occurred by chance alone.
|
|||||||||||||||||||||||||||||||||||||||||||||||||||||||||||||||||||||||||||||||||||||||||||||||||||||||||||||||||||||||||||||||||||||||||||||||||||||||||||||||||
|
2 |
Identify the group with the highest exclusion rate. Ohio divides its student population into seven racial groups: American Indian, Asian, Black, Hispanic, Multiracial, Pacific Islander, and white. For each district, we identified the racial group with the highest exclusion rate. Every racial group was represented. But the representation wasn't equitable. For instance: for 354 of the districts (40.3%) blacks had the highest exclusion rate; for 119 of the districts(13.5%) whites had the highest exclusion rate; Asians with had the highest exclusion rate in 26 (3.0%) of the schools/districts ; while, American Indians, with a mean of 92.9 exclusions per 100 students, had the highest mean exclusion rate in 63 of the districts. The mean highest exclusion rate was lowest for whites (29.4) This difference base on race was statistically significant. (p=.000) That is zero probability that differences occurred by chance alone.
|
|||||||||||||||||||||||||||||||||||||||||||||||||||||||||||||||||||||||||||||||||||||||||||||||||||||||||||||||||||||||||||||||||||||||||||||||||||||||||||||||||
|
3 |
Calculate the number of different racial groups in a school/district. Ohio reports racial data in seven categories: American Indian or Alaskan Native, Asian, Black or African American (non-Hispanic), Hispanic, Multiracial, Pacific Islander, and White (non-Hispanic). It is important to remember that the 879 districts include both multiple school districts and a single school district. However, no district had only one racial group. The smallest number of racial groups in a school/district was 2; 6 of the districts (.7%) had only two racial groups. Two hundred sixty-six districts (30.3%) had all seven racial groups. Schools with more racial groups had overall lower mean highest exclusion rate. This difference based on racial groups in a school/district was statistically significant. (p=.002) That is, there is less than a .2% probability that differences occurred by chance alone.
|
|||||||||||||||||||||||||||||||||||||||||||||||||||||||||||||||||||||||||||||||||||||||||||||||||||||||||||||||||||||||||||||||||||||||||||||||||||||||||||||||||
|
4 |
Calculate Average Exclusion Rate of all Racial Groups in the district EXCEPT the group with the highest Exclusion Rate. In calculating our ratio, we compared the racial group with the highest exclusion rate to the rest of the students in that particular school/district. The mean average rate of other racial groups 10.9; the median average exclusion rate was 4.2; that is half the schools had average exclusion rate of fewer than 4.2 exclusions per 100 students. Several schools had no exclusions for other groups. The maximum average exclusion rate for other schools was 147.6.
|
|||||||||||||||||||||||||||||||||||||||||||||||||||||||||||||||||||||||||||||||||||||||||||||||||||||||||||||||||||||||||||||||||||||||||||||||||||||||||||||||||
|
5 |
Calculate the Racial Disparity Ratio. The racial disparity ratio was calculated by dividing the Highest Exclusion rate (Step 2) by the Average Exclusion Rate (Step 4). We can calculate the ratio for 879 districts. The ratio compares values. A ratio says how much of one thing there is compared to another thing. Ratio 3:1. There are three blue squares to 1 yellow square. We report the ratio as a single number because in all cases, the second number is one. That is, a racial disparity ratio of 2.3 means that in a particular school district, the group with the highest exclusion rate has 2.3 times more than the average racial exclusion rate for the other group. In this case, the average racial disparity ratio is 15.6 which means that for Ohio schools, the group with the highest racial exclusion rate is 15.6 times more likely to be excluded than the other students at the particular district. Half the districts had a racial disparity ratio above 4.9
Community (Charter) Schools had a lower mean racial disparity ratio than Public districts. They also had a lower median with half their schools having a racial disparity ratio of less than 3.6. That is, in half the community charter schools, the racial group with the highest exclusions were only 3.6 times more likely to be excluded compared to the 5.4 times more likely in Public Districts. This difference in a racial disparity ratio based on Organization type was statistically significant (p=.005). That is there is less than a .5% chance that this difference in racial disparity ratio based on organization type occurred by chance alone
Type 8 Urban districts had the lowest mean racial disparity ratio. They also had the lowest median with half their schools having a racial disparity ratio of less than 3.0. That is, in half the Type 8 Urban Public districts the racial group with the highest exclusions were only 3.0 times more likely to be excluded compared to the 8.7 times more likely in Type 3 Small Town schools/districts. This difference in a racial disparity ratio based on Typology of Public District was statistically significant (p=.000). That is there is zero chance that this difference in racial disparity ratio based on occurred by chance alone.
|
|||||||||||||||||||||||||||||||||||||||||||||||||||||||||||||||||||||||||||||||||||||||||||||||||||||||||||||||||||||||||||||||||||||||||||||||||||||||||||||||||
Best School Districts
The best schools all had racial disparity ratio of less than 1.5. That is the racial group with the highest exclusion rate was less than 1.5 times more likely to be excluded than the average exclusion rate for other students in that school/district. Three schools had no racial disparity because they had no exclusions. Those schools were Ottoville local, Pettisville local and Russia Local. Another 40 schools had racial disparity ratio greater than zero but less than 1.5. Of those 44 schools, 65.9% (29) were public districts, and the other 34.1% were charter schools. Of the 29 Public districts with a racial disparity ration of less than 1.5, none were urban schools. In 44 best schools/districts, Whites were the group with the highest exclusion rate. The number of different racial groups in the best schools/districts ranged from 3 to 7 with the average and the median number is 5. (NOTE: For some school districts this is an approximation of the racial disparity ratio since they report enrollment as "less than10" and exclusions as "less than 10". In those circumstances, we used "5" as the enrollment number and "3" as the exclusion number. Please check with your school district for more accurate information)
|
School Districts with Racial Disparity Ratio <= 1.44 |
|||||
|
Racial Disparity Ratio |
Highest Exclusion Rate |
Average Exclusion rate minus highest Group |
Number of Different Racial Groups |
||
|
Number |
44 |
44 |
44 |
44 |
|
|
Mean |
0.9 |
14.7 |
10.9 |
4.9 |
|
|
Median |
1.0 |
1.0 |
0.0 |
5.0 |
|
|
Minimum |
0.0 |
0.0 |
0.0 |
3.0 |
|
|
Maximum |
1.4 |
133.5 |
116.8 |
7.0 |
|
|
IRN |
District Name |
Racial Disparity Ratio |
Racial Group With Highest Exclusion Rate |
Number of Different Racial Groups in District |
Organization Type |
Typology of Public Districts |
|
049817 |
Russia Local |
0.0 |
None |
5 |
Public District |
Type 2: Rural - Average Student Poverty & Very Small Student Population |
|
047076 |
Pettisville Local |
0.0 |
None |
6 |
Public District |
Type 2: Rural - Average Student Poverty & Very Small Student Population |
|
049387 |
Ottoville Local |
0.0 |
None |
5 |
Public District |
Type 2: Rural - Average Student Poverty & Very Small Student Population |
|
048553 |
Marion Local |
0.1 |
White |
4 |
Public District |
Type 2: Rural - Average Student Poverty & Very Small Student Population |
|
000556 |
A+ Arts Academy |
0.2 |
Black |
5 |
Community (Charter) School |
|
|
048215 |
Ottawa Hills Local |
0.3 |
White |
6 |
Public District |
Type 6: Suburban - Very Low Student Poverty & Large Student Population |
|
049338 |
Jennings Local |
0.3 |
White |
4 |
Public District |
Type 2: Rural - Average Student Poverty & Very Small Student Population |
|
047688 |
East Holmes Local |
0.3 |
White |
6 |
Public District |
Type 1: Rural - High Student Poverty & Small Student Population |
|
048991 |
Antwerp Local |
0.3 |
White |
5 |
Public District |
Type 1: Rural - High Student Poverty & Small Student Population |
|
050625 |
Edon Northwest Local |
0.4 |
White |
6 |
Public District |
Type 1: Rural - High Student Poverty & Small Student Population |
|
011468 |
Columbus Bilingual Academy-North |
0.4 |
Hispanic |
4 |
Community (Charter) School |
|
|
046003 |
Shadyside Local |
0.5 |
White |
6 |
Public District |
Type 3: Small Town - Low Student Poverty & Small Student Population |
|
050054 |
Revere Local |
0.5 |
White |
7 |
Public District |
Type 6: Suburban - Very Low Student Poverty & Large Student Population |
|
000162 |
Newark Digital Academy |
0.5 |
White |
5 |
Community (Charter) School |
|
|
048587 |
St Henry Consolidated Local |
0.6 |
White |
5 |
Public District |
Type 2: Rural - Average Student Poverty & Very Small Student Population |
|
045393 |
Granville Exempted Village |
0.6 |
White |
7 |
Public District |
Type 6: Suburban - Very Low Student Poverty & Large Student Population |
|
050179 |
Joseph Badger Local |
0.7 |
White |
5 |
Public District |
Type 2: Rural - Average Student Poverty & Very Small Student Population |
|
048579 |
Parkway Local |
0.8 |
White |
5 |
Public District |
Type 2: Rural - Average Student Poverty & Very Small Student Population |
|
046722 |
Northeastern Local |
0.8 |
White |
7 |
Public District |
Type 3: Small Town - Low Student Poverty & Small Student Population |
|
048322 |
Jackson-Milton Local |
0.9 |
White |
4 |
Public District |
Type 3: Small Town - Low Student Poverty & Small Student Population |
|
044149 |
Ironton City |
0.9 |
White |
6 |
Public District |
Type 4: Small Town - High Student Poverty & Average Student Population Size |
|
050328 |
Fairbanks Local |
0.9 |
White |
6 |
Public District |
Type 3: Small Town - Low Student Poverty & Small Student Population |
|
049395 |
Pandora-Gilboa Local |
1.0 |
White |
4 |
Public District |
Type 2: Rural - Average Student Poverty & Very Small Student Population |
|
048595 |
Fort Recovery Local |
1.0 |
White |
6 |
Public District |
Type 2: Rural - Average Student Poverty & Very Small Student Population |
|
049312 |
Columbus Grove Local |
1.0 |
White |
5 |
Public District |
Type 2: Rural - Average Student Poverty & Very Small Student Population |
|
000525 |
Canton Harbor High School |
1.1 |
White |
5 |
Community (Charter) School |
|
|
045211 |
Bluffton Exempted Village |
1.1 |
White |
7 |
Public District |
Type 3: Small Town - Low Student Poverty & Small Student Population |
|
000609 |
Summit Academy School - Lorain |
1.1 |
Hispanic |
4 |
Community (Charter) School |
|
|
046011 |
Union Local |
1.2 |
White |
5 |
Public District |
Type 1: Rural - High Student Poverty & Small Student Population |
|
151191 |
The Capella Institute |
1.2 |
Black |
4 |
Community (Charter) School |
|
|
012038 |
Old Brook High School |
1.2 |
White |
4 |
Community (Charter) School |
|
|
008064 |
Monroe Preparatory Academy |
1.2 |
Multiracial |
4 |
Community (Charter) School |
|
|
134072 |
Youngstown Community School |
1.2 |
Multiracial |
3 |
Community (Charter) School |
|
|
133629 |
Horizon Science Acad Cleveland |
1.3 |
Hispanic |
4 |
Community (Charter) School |
|
|
000306 |
Summit Academy Community School - Cincinnati |
1.3 |
Hispanic |
4 |
Community (Charter) School |
|
|
143552 |
Eagle Academy |
1.4 |
Black |
4 |
Community (Charter) School |
|
|
151209 |
Life Skills Of Northeast Ohio |
1.4 |
Black |
4 |
Community (Charter) School |
|
|
133678 |
Riverside Academy |
1.4 |
Hispanic |
4 |
Community (Charter) School |
|
|
050518 |
Wolf Creek Local |
1.4 |
White |
6 |
Public District |
Type 1: Rural - High Student Poverty & Small Student Population |
|
048975 |
Put-In-Bay Local |
1.4 |
White |
3 |
Public District |
|
|
050567 |
Norwayne Local |
1.4 |
White |
6 |
Public District |
Type 3: Small Town - Low Student Poverty & Small Student Population |
|
047571 |
Holgate Local |
1.4 |
White |
4 |
Public District |
Type 2: Rural - Average Student Poverty & Very Small Student Population |
|
049775 |
Fairlawn Local |
1.4 |
White |
3 |
Public District |
Type 2: Rural - Average Student Poverty & Very Small Student Population |
|
000131 |
Glass City Academy |
1.4 |
White |
4 |
Community (Charter) School |
Worst School Districts
The worst schools all had racial disparity ratio over 100. That is, students in the racial group, with the highest exclusion rate, are at least 100 times more likely to be excluded than other students. For instance, Fort Loramie Local had an 800 racial disparity ratio. That means that Multiracial students were 800 times more likely to be excluded than students in other racial groups. Of the 20 districts, 85% were public districts. Of the public districts, 60% (17) occurred in rural districts (type 1 and Type 2). In 10 districts, Blacks were the racial group with the highest exclusion rate. Asian and whites only had one district, respectively, where they were the racial group with the highest exclusion rate. (NOTE: For some school districts this is an approximation of the racial disparity ratio since they report enrollment as "less than10" and exclusions as "less than 10". In those circumstances, we used "5" as the enrollment number and "3" as the exclusion number. Please check with your school district for more accurate information)
|
School Districts with Racial Disparity Ratio >= 100 |
|||||
|
Racial Disparity Ratio |
Highest Exclusion Rate |
Average Exclusion rate minus highest Group |
Number of Different Racial Groups |
||
|
Number |
20.0 |
20.0 |
20.0 |
20.0 |
|
|
Mean |
283.5 |
76.7 |
0.4 |
5.0 |
|
|
Median |
182.4 |
60.0 |
0.3 |
5.0 |
|
|
Minimum |
100.0 |
10.0 |
0.0 |
2.0 |
|
|
Maximum |
800.0 |
143.1 |
1.2 |
6.0 |
|
|
IRN |
District Name |
Racial Disparity Ratio |
Racial Group With Highest Exclusion Rate |
Organization Type |
Typology of Public Districts |
|
049783 |
Fort Loramie Local |
800.0 |
Multiracial |
Public District |
Type 2: Rural - Average Student Poverty & Very Small Student Population |
|
045955 |
New Bremen Local |
600.0 |
Asian |
Public District |
Type 3: Small Town - Low Student Poverty & Small Student Population |
|
047928 |
Dawson-Bryant Local |
600.0 |
Black |
Public District |
Type 2: Rural - Average Student Poverty & Very Small Student Population |
|
045633 |
Versailles Exempted Village |
480.0 |
Multiracial |
Public District |
Type 2: Rural - Average Student Poverty & Very Small Student Population |
|
045963 |
New Knoxville Local |
480.0 |
Multiracial |
Public District |
Type 2: Rural - Average Student Poverty & Very Small Student Population |
|
046524 |
Wynford Local |
428.6 |
Black |
Public District |
Type 1: Rural - High Student Poverty & Small Student Population |
|
048512 |
Eastern Local |
300.0 |
Hispanic |
Public District |
Type 2: Rural - Average Student Poverty & Very Small Student Population |
|
046276 |
Southeastern Local |
266.7 |
Black |
Public District |
Type 3: Small Town - Low Student Poverty & Small Student Population |
|
047472 |
Vanlue Local |
218.2 |
Black |
Public District |
Type 2: Rural - Average Student Poverty & Very Small Student Population |
|
050641 |
North Central Local |
206.9 |
Multiracial |
Public District |
Type 1: Rural - High Student Poverty & Small Student Population |
|
049700 |
Hopewell-Loudon Local |
157.9 |
Black |
Public District |
Type 3: Small Town - Low Student Poverty & Small Student Population |
|
000311 |
Bridges Community Academy |
150.0 |
Black |
Community (Charter) School |
|
|
015329 |
Istem Geauga Early College High School |
150.0 |
Hispanic |
Community (Charter) School |
|
|
148932 |
Franklin Local Community School |
143.1 |
White |
Community (Charter) School |
|
|
048637 |
Newton Local |
133.3 |
Black |
Public District |
Type 2: Rural - Average Student Poverty & Very Small Student Population |
|
050138 |
Champion Local |
130.4 |
Black |
Public District |
Type 3: Small Town - Low Student Poverty & Small Student Population |
|
047837 |
Danville Local |
125.0 |
Black |
Public District |
Type 2: Rural - Average Student Poverty & Very Small Student Population |
|
049759 |
Anna Local |
100.0 |
Multiracial |
Public District |
Type 3: Small Town - Low Student Poverty & Small Student Population |
|
049320 |
Continental Local |
100.0 |
Multiracial |
Public District |
Type 2: Rural - Average Student Poverty & Very Small Student Population |
|
046060 |
Western Brown Local |
100.0 |
Black |
Public District |
Type 1: Rural - High Student Poverty & Small Student Population |
Searchable Database - Racial Disparity (Searchable Database)
This database covers only information related to Racial Disparity.
For more detail, see individual schools/district page.
(NOTE: For some school districts this is an approximation of the racial disparity ratio since districts that report enrollment as "less than10" and exclusions as "less than 10". In those circumstances, we used "5" as the enrollment number and "3" as the exclusion number. Please check with your school district for more accurate information)
This database has two visible pages - list of all records (initially) or records that meet the condition (on search), and a detailed view of the selected record. When you click on any record in the list, a detailed report will be returned for the selected record.
For More Information on Racial Justice Now and School Discipline: RJNOhio.org