
The Regional LSAC Pool and Excess Whiteness
 The LSAC applicant pool included 10 LSAC regions. Regional whiteness was calculated by adding the total applications for the states in the region; the total white applicants for the states in the region; and dividing total white applicants by total applicants. The table identifies the Whiteness in the regional applicant pool. Excess Whiteness for a school is calculated by subtracting the percentage of white students in the first-year enrollment for 2017 through 2019 from the percentage of white students in the regional applicant pool. The Midwest had the Whitest applicant pool (84%) and the Far West had the least White applicant pool (40%).
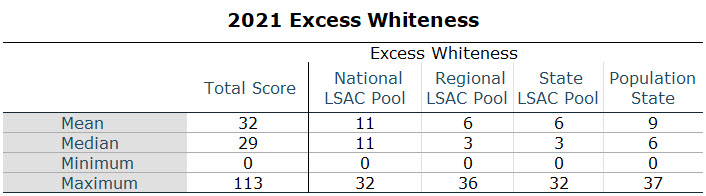
Of the 200 law schools in this report, 119 (59.5%) had more White students in their first-year class than in their regional LSAC application pool. Of the 119 law schools with Excess Whiteness, the minimum number of Excess Whiteness points was 1. The maximum number of Excess Whiteness points was 36. The mean (average) number of Excess Whiteness points was 6.6. Half the schools had fewer than 2.5 Excess Whiteness points.
| Region Name | States in Region | Whiteness in Applicant Pool |
| Far West | Alaska, California, Hawaii, Nevada | 41% |
| Great Lakes | Illinois, Indiana, Michigan, Minnesota, Ohio, Wisconsin | 76% |
| Midsouth | Delaware, District of Columbia, Kentucky, Maryland, North Carolina, Tennessee, Virginia, West Virginia | 70% |
| Midwest | Iowa, Kansas, Missouri, Nebraska, North Dakota, South Dakota | 84% |
| Mountain West | Arizona, Colorado, Idaho, Montana, New Mexico, Utah, Wyoming | 76% |
| New England | Connecticut, Maine, Massachusetts, New Hampshire, Rhode Island, Vermont | 77% |
| Northeast | New Jersey, New York, Pennsylvania | 66% |
| Northwest | Oregon, Washington | 73% |
| South Central | Arkansas, Louisiana, Oklahoma, Texas | 58% |
| Southeast | Alabama, Florida, Georgia, Mississippi, South Carolina, Puerto Rico | 50% |