
When It Comes to
Preventing the School-to-Prison Pipeline,
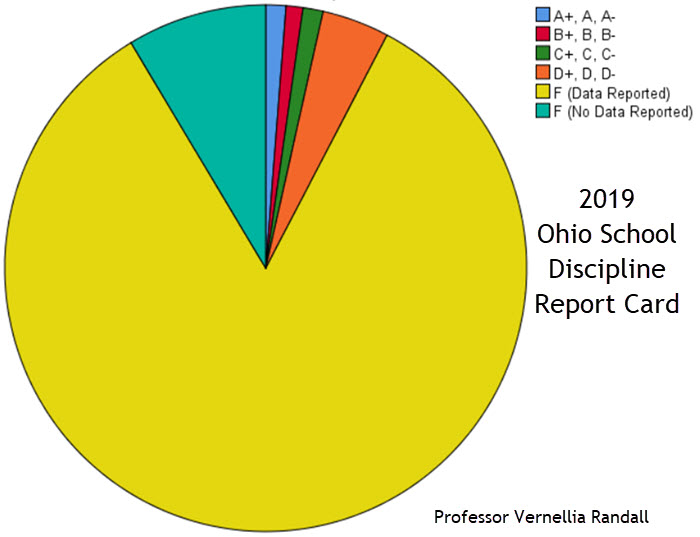
Ohio Schools are Failing!
Some Ohio schools suspend students as early as pre-school, and unfortunately, suspensions are being handed out in a racially biased way. Further, schools send students home for non-violent and subjective offenses. Suspended students are more likely to be dismissed from school. [1] Students who are suspended an/or dismissed from school are at an increased risk of incarceration later in life.[2] This phenomenon is called the School-to-Prison Pipeline.
The Ohio Department of Education produces an annual report card on racial disparities in Ohio schools, evaluating various criteria, but school discipline is not one of the areas evaluated.[3] A school discipline report card is necessary because parents need to be informed about this performance factor when choosing a school for their child. Also, policymakers need access to this information so that they can make changes in the operation and practices of their schools. This report is intended to fill in that missing information for parents and policymakers.
“Blacks who dropout have a 70% chance of going to prison. Students who have one suspension in 9th grade are only half as likely to graduate. The school-to-prison pipeline has been clearly demonstrated.”
Professor Emerita Vernellia Randall,
The University of Dayton School of Law
The Ohio School discipline report card evaluates three components: exclusions, subjective behavior, and racial disparity.
- Exclusions: Exclusion is the combined rate of out of school suspensions, expulsions, emergency removal by a hearing officer and removal by district/school personnel. There is also a penalty for any exclusions in pre-kindergarten through 3rd grade and excessive exclusions in the 9th grade.
- Subjective behavior: When a student is disciplined, the behavior prompting the discipline can be either objective (i.e., excessive tardiness) or subjective (i.e., insubordination). Exclusion for subjective behavior is problematic because subjective standards are more likely to be influenced by explicit and implicit biases.[4] We calculated the subjective behavior grade based on the percentage of exclusions that was for disruptive/disobedient behavior, harassment/intimidation, and unwelcome sexual conduct.
- Racial disparity: Racial disparity evaluates the difference in exclusion based on race. In this report, it is measured by dividing the rate of the racial group with the highest exclusions by the rate of the racial group with the lowest exclusions.
The school discipline report card will educate the community, provide information as to how a school district/school is performing on the school to prison pipeline, and allow the community to compare one school against others on this critical performance metric.
The Ohio school discipline report card evaluates 1173 different school entities.
The 2019 Ohio School Discipline report is based on data reported to the Ohio Department of Education. The discipline and enrollment data is for 2017 - 2018 and is the most recent data available as of February 1, 2019.
Organizational Type
Information about Organizational type came from the Ohio Educational Directory System (OEDS). This report includes information on 1173. Schools. Of those 1173, 52.2% (612) are public districts and 29.7% (348) are Community (Charter) Schools.
|
Organizational Type |
Number |
Percent |
|
Career Technical Planning district/school |
94 |
8.0 |
|
Community (Charter) School |
348 |
29.7 |
|
Educational Service Center |
49 |
4.2 |
|
Joint Vocational School district/school |
49 |
4.2 |
|
Nonpublic district/school |
16 |
1.4 |
|
Public district/school |
612 |
52.2 |
|
Tech Prep. Regional Centers |
5 |
0.4 |
|
Total |
1173 |
100.0 |
|
See, OEDS Data Search, https://oeds.ode.state.oh.us/DataExtract |
||
Typology of Ohio Public Districts
In 1996, ODE created a classification system making it easier to compare similar districts referred to as the typology of Ohio school districts.[5] In 2007, the typology was revised to take advantage of the 2000 census data. With the availability of more recent data from the 2010 census ODE again revised the typology for 2013. [6] ODE has not revised the typology since 2013. [7] Consequently, its accuracy is highly suspect. However, the typology provides valuable information.
Of the 1173 districts, 607 (51.7%) had a typology. Of those 607, 209 (37.8%) were rural; 200 (33%) were small town; 123 (20.3%) were Suburban and 53 (9.0%) were Urban.
|
Typology of Ohio Public School Districts |
Frequency |
Percent |
Valid Percent |
|
Type 1: Rural - High Student Poverty & Small Student Population |
123 |
10.5 |
20.3 |
|
Type 2: Rural - Average Student Poverty & Very Small Student Population |
106 |
9.0 |
17.5 |
|
Type 3: Small Town - Low Student Poverty & Small Student Population |
111 |
9.5 |
18.3 |
|
Type 4: Small Town - High Student Poverty & Average Student Population Size |
89 |
7.6 |
14.7 |
|
Type 5: Suburban - Low Student Poverty & Average Student Population Size |
77 |
6.6 |
12.7 |
|
Type 6: Suburban - Very Low Student Poverty & Large Student Population |
46 |
3.9 |
7.6 |
|
Type 7: Urban - High Student Poverty & Average Student Population |
47 |
4.0 |
7.7 |
|
Type 8: Urban - Very High Student Poverty & Very Large Student Population |
8 |
0.7 |
1.3 |
|
Total |
607 |
51.7 |
100.0 |
|
Missing |
566 |
48.3 |
|
|
|
1173 |
100.0 |
|
|
See, Typology of Ohio School Districts, http://education.ohio.gov/Topics/Data/Report-Card-Resources/Report-Card-Data-Forms-and-Information/Typology-of-Ohio-School-Districts (Last Visited: February 10, 2019). |
|||
Ohio School Student Enrollment
The reported school enrollment for the state of Ohio for 2017- 2018 for the 1054 districts/schools in this report was 1722300. Two school districts did not report their enrollment ( Foxfire Intermediate School and Pleasant Community Digital). Kelleys Island Local (n=5) had the lowest enrollment and the Columbus City School district/school (N=50050) the largest. The Mean (Average) enrollment was 1634. Most (90.5%) students were enrolled in Public district/school with 6.4% being enrolled in Community (Chart) Schools. In Public Districts, Type 2: Rural had the lowest mean student enrollment (937) and Type 8 Urban districts had the highest mean (24373).
|
Reported Enrollment (Rounded) |
|||||
|
Included |
Excluded |
Total |
|||
|
N |
Percent |
N |
Percent |
N |
Percent |
|
1054 |
89.9% |
119 |
10.1% |
1173 |
100.0% |
|
Reported Enrollment (Rounded) by Organization Type |
N |
Median |
Mean |
Minimum |
Maximum |
Sum |
|
Community (Charter) School |
346 |
193 |
283 |
14 |
4651 |
98014 |
|
Educational Service Center |
49 |
222 |
471 |
10 |
9998 |
23061 |
|
Joint Vocational School district/school |
49 |
691 |
861 |
205 |
3666 |
42194 |
|
Public district/school |
610 |
1559 |
2556 |
5 |
50050 |
1559030 |
|
Total |
1054 |
828 |
1634 |
5 |
50050 |
1722300
|
|
Reported Enrollment (Rounded) by Typology of Public Districts |
N |
Median |
Mean |
Minimum |
Maximum |
|
Type 1: Rural - High Student Poverty & Small Student Population |
123 |
1025.00 |
1219.04 |
230 |
3786 |
|
Type 2: Rural - Average Student Poverty & Very Small Student Population |
106 |
871.00 |
934.03 |
203 |
2187 |
|
Type 3: Small Town - Low Student Poverty & Small Student Population |
111 |
1417.08 |
1551.48 |
365 |
3996 |
|
Type 4: Small Town - High Student Poverty & Average Student Population Size |
89 |
1921.25 |
2051.60 |
368 |
6358 |
|
Type 5: Suburban - Low Student Poverty & Average Student Population Size |
77 |
4000.24 |
4024.29 |
745 |
9202 |
|
Type 6: Suburban - Very Low Student Poverty & Large Student Population |
46 |
3747.85 |
5365.98 |
712 |
20386 |
|
Type 7: Urban - High Student Poverty & Average Student Population |
47 |
3619.47 |
4327.58 |
494 |
22761 |
|
Type 8: Urban - Very High Student Poverty & Very Large Student Population |
8 |
22167.58 |
24373.00 |
5266 |
50050 |
|
Total |
607 |
1564.12 |
2568.11 |
203 |
50050 |
For More Information on Racial Justice Now and School Discipline:
RJNOhio.org
Footnotes and References
[1] Daniel J. Losen (editor), Closing the School Discipline Gap: Equitable Remedies for Excessive Exclusion (2015)
[2] Daniel J. Losen (editor), Closing the School Discipline Gap: Equitable Remedies for Excessive Exclusion (2015)
[3] School-to-prison Pipeline, https://en.wikipedia.org/wiki/School-to-prison_pipeline (Last Visited: June 11, 2019).
[4] Gina Laura Gullo, Kelly Capatosto and Cheryl Staats, Implicit Bias in Schools: A Practitioner’s Guide (2019).
[5] See, Typology of Ohio School Districts, http://education.ohio.gov/Topics/Data/Report-Card-Resources/Report-Card-Data-Forms-and-Information/Typology-of-Ohio-School-Districts (Last Visited: February 10, 2019).
[6] See, Typology of Ohio School Districts, http://education.ohio.gov/Topics/Data/Report-Card-Resources/Report-Card-Data-Forms-and-Information/Typology-of-Ohio-School-Districts (Last Visited: February 10, 2019).
[7] See, Typology of Ohio School Districts, http://education.ohio.gov/Topics/Data/Report-Card-Resources/Report-Card-Data-Forms-and-Information/Typology-of-Ohio-School-Districts (Last Visited: February 10, 2019).